Visionary Voronoi
Burkard Polster and Marty Ross
The Age, 21 October 2013
It's happened again. After six years of cataloguing Victoria's mathematically inspired architecture, your Maths Masters were sure they'd seen it all. But no: in the heart of Melbourne we've stumbled across yet another beautifully mathematical building.
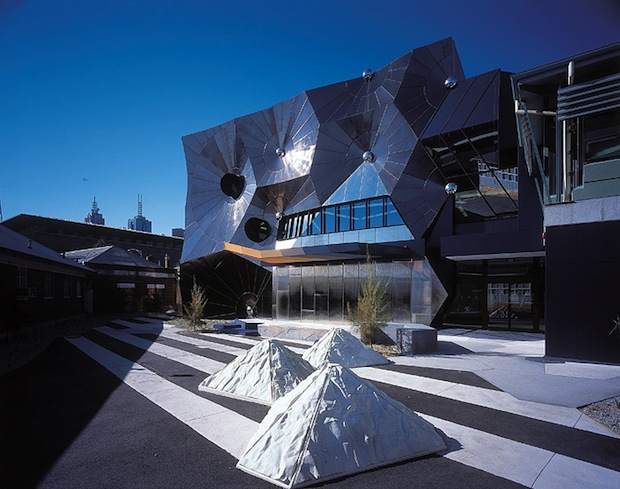
Earlier this year we took an excursion to Melbourne's outskirts, to visit the Klein bottle house on the Mornington Peninsula. Now we're back in the city, checking out the Victorian College of the Arts' Centre for Ideas. Located in Southbank, the award-winning CFI was completed in 2001. It was designed by Melbourne-based Minifie van Schaik Architects, who were also responsible for Healesville Sanctuary's Wildlife Health Centre, the inspiration for another of our mathematical expeditions. (The splendid photo is reproduced with the kind permission of Peter Bennetts.)
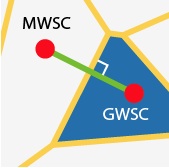
CFI's striking façade is inspired by what is known as a Voronoi diagram. We pondered such diagrams a few years back, when discussing the zoning of Melbourne's public schools. The following diagram shows the zoning of secondary schools in the neighbourhood of Glen Waverley Secondary College.

To construct the diagram we begin by plotting the locations of all the schools. Then each school's zone, called a Voronoi cell, comprises all those points that are closer to that school than to any other.
In our previous column we noted that all the edges of a Voronoi cell must be straight lines. Moreover, the common edge of two adjacent zones is easily located: draw the straight line connecting the two schools, and then the shared boundary is the perpendicular bisector of the connecting line.
This provides a natural, if somewhat fiddly, method of constructing a Voronoi diagram. There turns out to be a very clever and much prettier method; it this method that inspired the CFI façade.
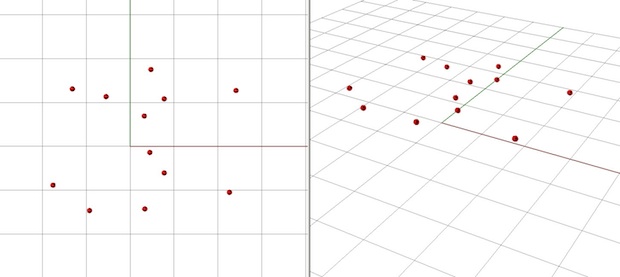
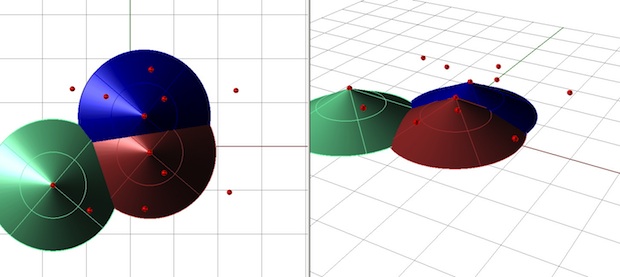
Start with the same points/schools as before, as in the left diagram below. Now, imagine each school hovering the same height above the ground, as pictured in perspective on the right.
Next, for each school draw a cone with apex at the school and descending down to the ground.
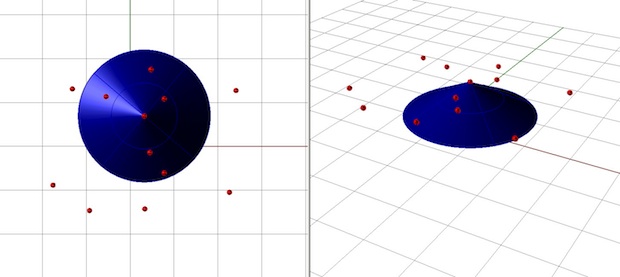
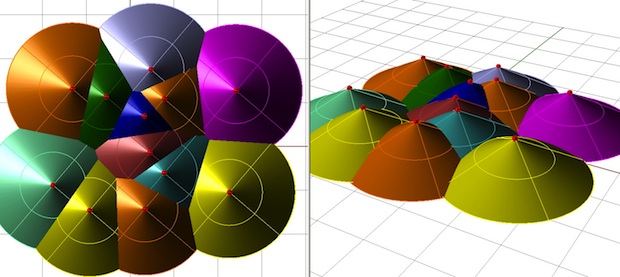
The cones will tend to run into each other, intersecting along (hyperbolic) curves. Any such curve of intersection will be equidistant from the apices of two cones. That means the top view of these curves exhibits the perpendicular bisectors that we used above to construct the Voronoi diagram.
Taking all the cones together, the top view of the resulting landscape exactly gives us our school zoning map. Very neat!
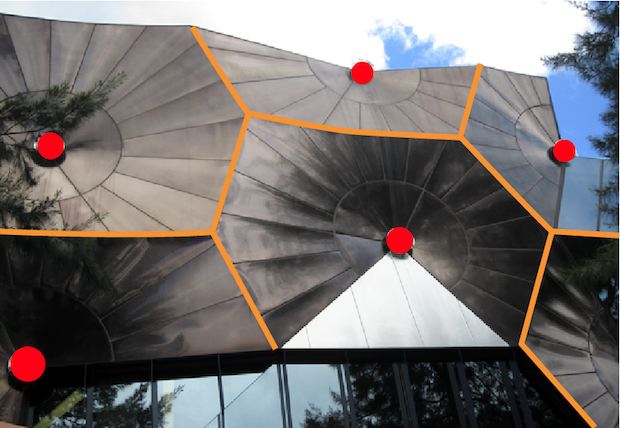
With a little highlighting, it's easy to see the Voronoi diagram in the CFI façade, together with the associated cones. It is a striking effect, and there is another hidden piece of engineering cunning. Since any part of a cone can be cut from a flat piece of metal the façade would have been relatively easy and cheap to construct.
So, not only are Voronoi diagrams extraordinarily useful, with all manner of important applications, they can also be extraordinarily beautiful. Another happy end to to another mathematical architectural tale.
Well, almost.
Alas, the Centre for Ideas building looks quite different these days:
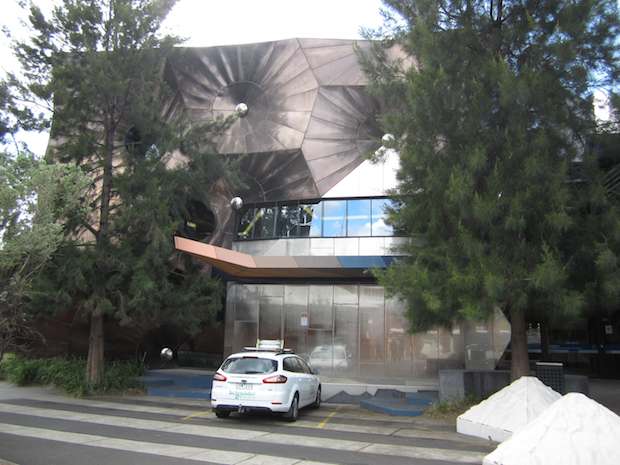
Yes, the little seedlings visible in the top photo are now all grown up, and up, almost totally obscuring CFI's beautiful façade. We are sure the Centre for Ideas is a fine institution, but the planting of those trees is an idea they could have well done without.
Burkard Polster teaches mathematics at Monash and is the university's resident mathemagician, mathematical juggler, origami expert, bubble-master, shoelace charmer, and Count von Count impersonator.
Marty Ross is a mathematical nomad. His hobby is helping Barbie smash calculators (and iPads) with a hammer.
Copyright 2004-∞ ![]() All rights reserved.
All rights reserved.